
This is another one of our posts in the series of How Not to Get Fooled by Statistics. We talked about cherry picking data, visualisation tricks, and data sources. Sometimes misleading data can stem from the flawed research methodology. There are many ways where research could go wrong if the methodology is not thought through. We will try to review a few common ones, but the list is not at all limited to them.
Sample sizes
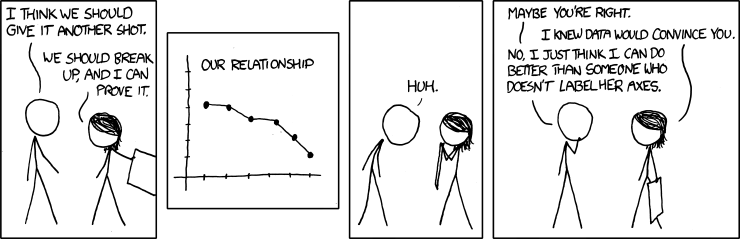
It is astonishing how often conclusions are made based on unreasonably small sample sizes. This cartoon illustrates that brilliantly.
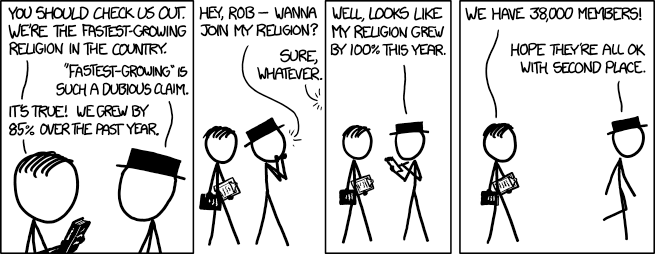
Image source :https://xkcd.com/
In this silly but very accurate example they used the percentage change on a sample of 1 person. First, you can never use percentages with small samples, you would need to always show absolute numbers. You may be wondering “How small is too small?”. Basically, there is no one universal correct answer. Some sources will tell you that a statistically acceptable minimum sample size is 30, some will say it’s 50. When we are dealing with data in real life we need to add some common sense to it. What is acceptable for one case may not be acceptable for another. So, basically when presented with any data it’s always important to know what the sample size is and is it representative of the population. Not mentioning that if something is “fastest growing” it doesn’t necessarily mean it’s good.
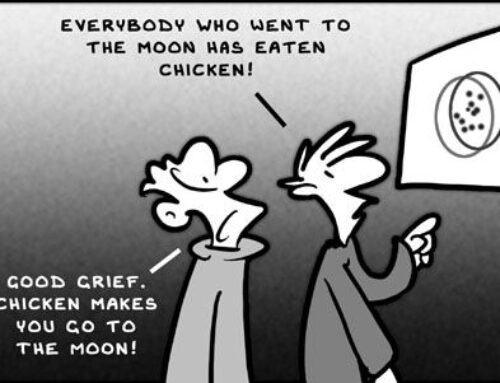
Loaded questions
Look at the following two questions:
- Doesn’t this cake taste nice?
- What do you think of the taste of this cake?
The wording of the first question is an example of a loaded question. It means that it almost nudges the respondent to give the answer that the researcher wants to get. The second question has a more neutral wording, so it does not affect the respondent’s opinion. While the cake example seems like a very innocent one, imagine if you were the cake manufacturer and research used the first example of the question for the taste test on your cakes. The results from that test would lead you to quite questionable decisions. These kinds of mistakes may happen by accident when the researcher doesn’t have much experience, but unfortunately questions are very often worded with bias on purpose to skew the results in a favourable direction. Unlike with some other types of mistakes this one is impossible to rectify other than re-doing the survey with a new questionnaire.
Sampling bias
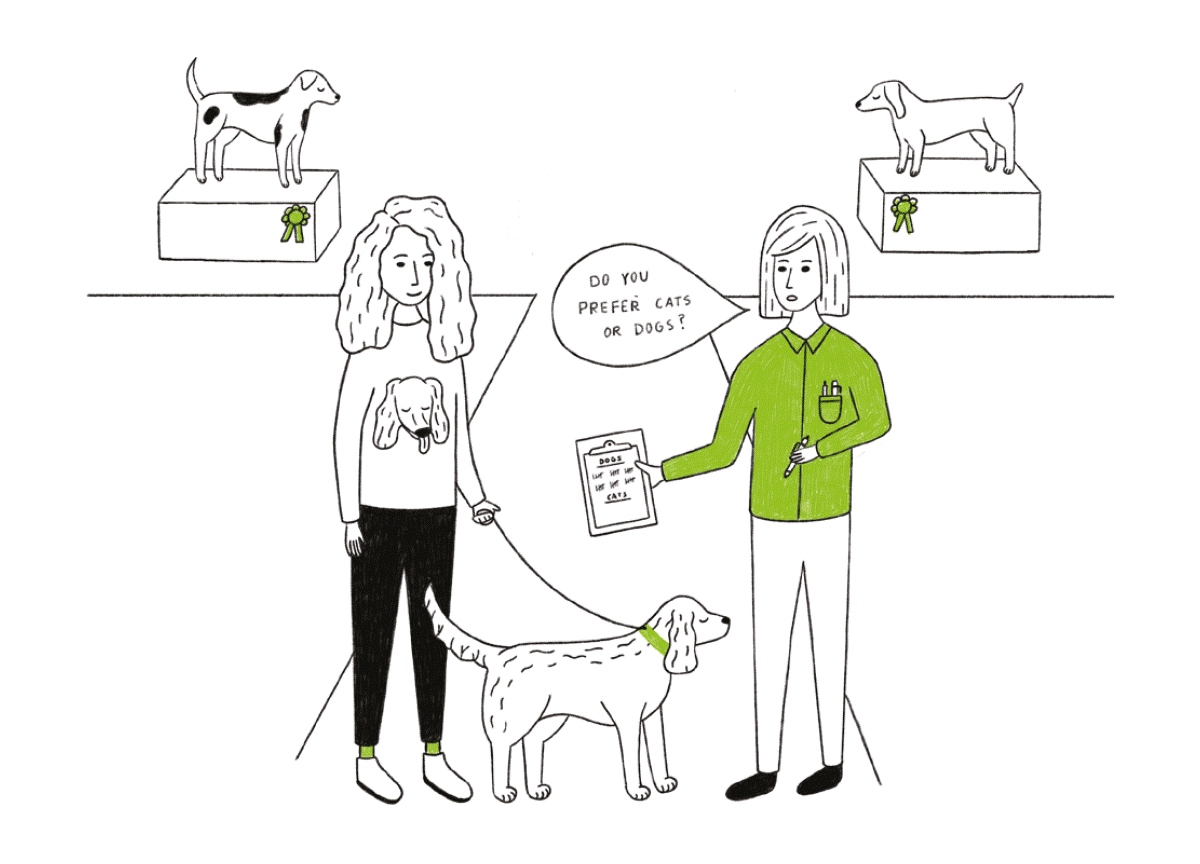
Image source: https://www.geckoboard.com/learn/data-literacy/statistical-fallacies/sampling-bias/
The sample you select for your survey must always be representative of the population you would like to understand. The most famous example for that must be the poll results on the presidential candidates by the Chicago Tribune in 1948 when they wrongly predicted the outcome of the elections.

https://commons.wikimedia.org/wiki/File:Dewey_Defeats_Truman_(AN-95-187)_resized.jpg
The problem with the poll was that it was a phone survey, but only a certain part of the population had a phone at their house, hence the sampling bias and the incorrect results.
As we mentioned in the beginning, there are numerous ways where a flawed methodology can affect the research results, and frankly we could talk endlessly about them. We will take a closer look at them further in one of our future post for DIY researchers.

[…] Dubious methodology […]
Fantastic web site. Plenty of helpful info here. I am sending it to several pals ans also sharing in delicious. And of course, thank you for your effort!